Transform Grid Transparency.
Today’s customers, regulators, and communities want to know where investments are being made and why. The DataCapable™ Platform’s Grid Improvement Map turns your reliability and modernization projects into a clear, visual story. By mapping upgrades, planned work, and completed projects, utilities build trust, transparency, and regulatory confidence.
Schedule Your Demo Now!

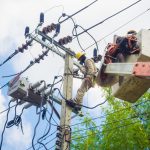
Display ongoing reliability improvements, completed work, & upcoming projects.
Layer contextual data like outage history, reliability, or community priorities.

Provide a clear picture of progress for regulators, boards, and the public.
Industries Benefiting from Our Grid Improvement Map
-
Show regulators and customers exactly how your investments improve reliability and transparency.
-
Highlight shared initiatives and infrastructure upgrades for community trust.

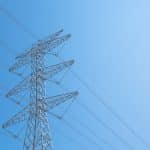
Advanced Visualization
of Grid Projects.
Turn complex utility work into simple, visual proof
points that resonate with stakeholders from regulators to ratepayers.
Getting Started is Simple. Here’s How:

1. Schedule a Demo
See your projects visualized in real time.

2. Sign Contract
Select the package that meets your regulatory and community needs.

3. Go Live
Deliver transparency and trust with your public grid improvement map.
Grid Improvement Map FAQ
How does the Grid Improvement Map support regulatory rate cases?
It provides a clear, visual record of grid investments and improvements, helping demonstrate transparency and accountability in rate case filings
Can we integrate outage history or reliability data?
Yes — the platform is designed to overlay outage history and reliability metrics alongside current projects for context.
Is the platform customizable by geography or service territory?
Absolutely — utilities can configure views by service territory, district, or specific regions to match regulatory and customer needs.
How often can project data be updated?
Project information can be refreshed as often as your internal systems allow, ensuring regulators and the public see the latest activity.
Can regulators and the public access the same view?
Yes — utilities can provide both regulators and the public with a shared transparency view, while also controlling sensitive details as needed.
How does this integrate with our outage map?
The Grid Improvement Map is built to complement the outage map, creating a seamless hub that shows both reliability history and forward-looking investments.